| TABLE OF CONTENTS | |
| Data Integrity | Pivot Mode |
| Report Navigation | Charts & Graphs |
| Running Custom Reports | Exporting Data |
DATA INTEGRITY
To ensure that your reporting is as accurate as possible you must first ensure that the information that is entered into the Xcelerate platform is also accurate. Make sure you and your teams are entering information as completely and accurately as possible.
It is also important that you have your Xcelerate platform integrated with additional programs such as QuickBooks to ensure that your financial information is complete.
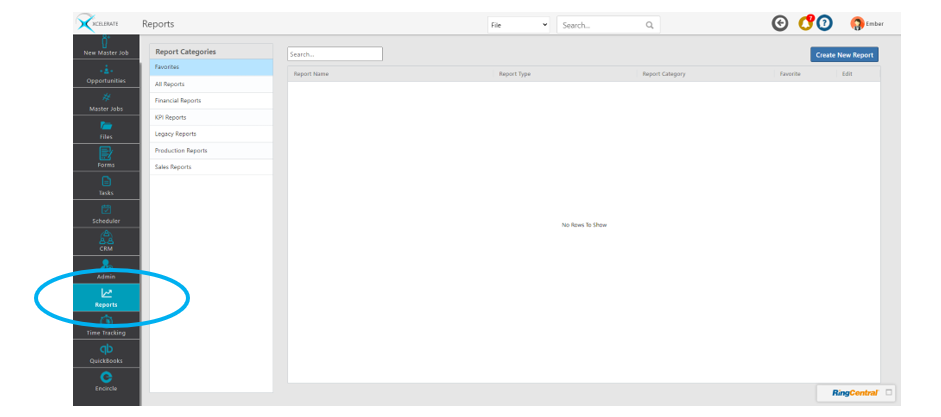
REPORT NAVIGATION
To pull reports click on the Reports Tab on the main side menu
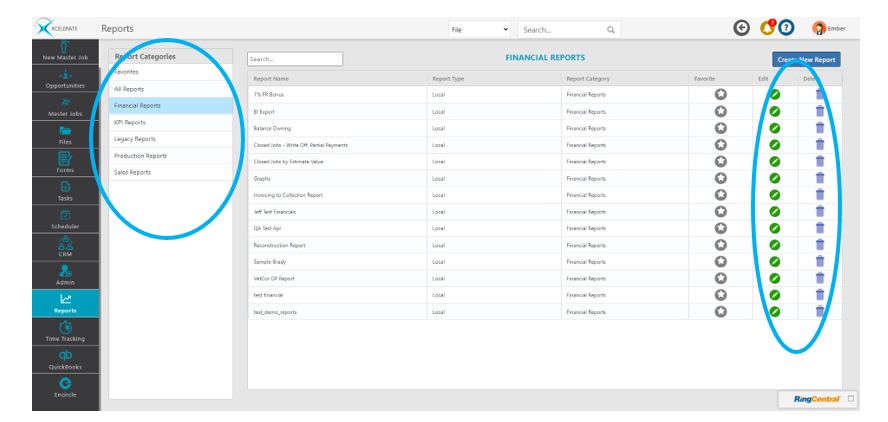
Previously saved reports or pre-loaded reports will appear in the left-side menu. These can be altered by clicking on the green edit button or deleted from the system by clicking using delete.
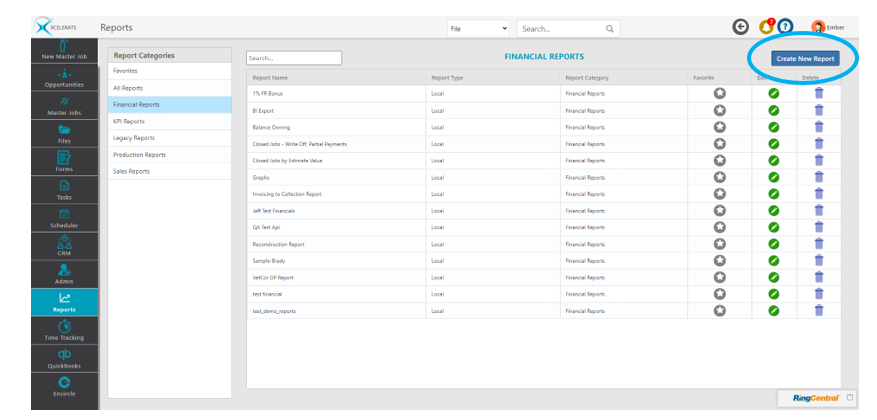
RUNNING CUSTOM REPORTS
To create a custom report, click on Create New Report
There are a vast number of reports that can be created utilizing this tool. Much like the file view, you can customize the columns and data that show within the report with the menu on the left.
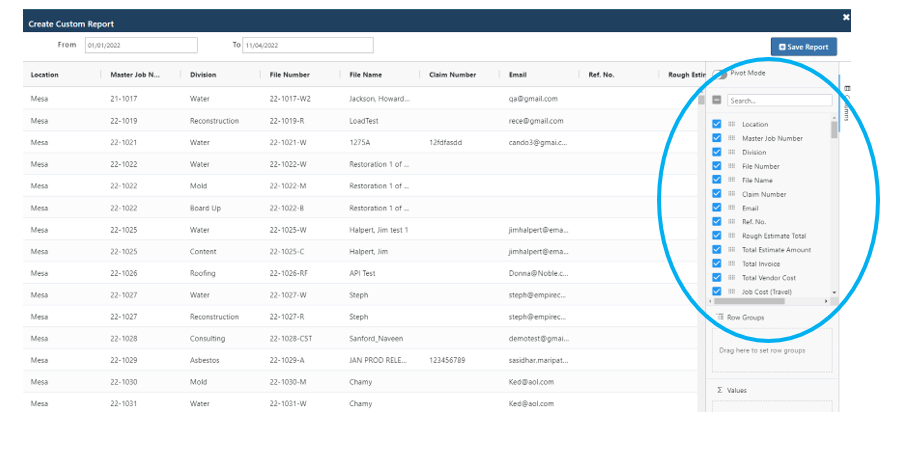
Removing all options and adding them back in is a great way to build a report that is specific to your needs. Generally, all reports will begin with the File Number & File Name. Add any additional columns as appropriate for the report.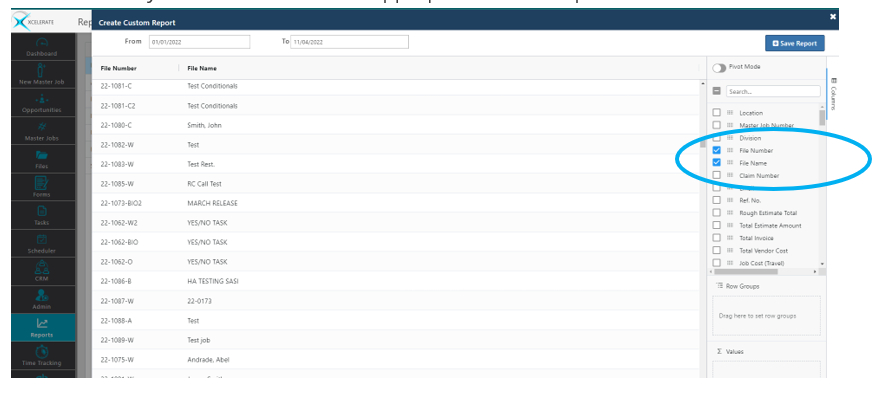
Columns can be adjusted through drag and drop as desired or sorted by clicking on the column header.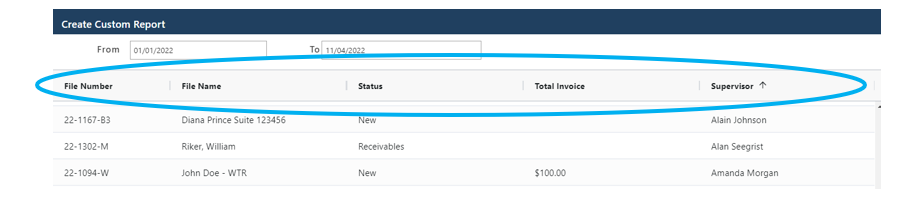
Once your report is complete click Save Report 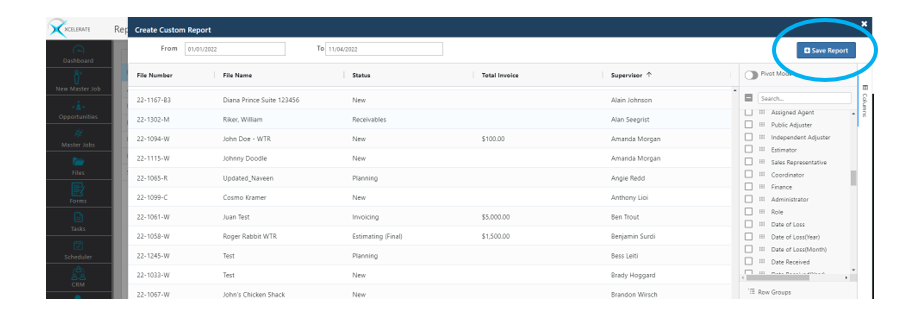
Enter the Report Name and Category & click Save. This report will then be available to retrieve quickly at any time.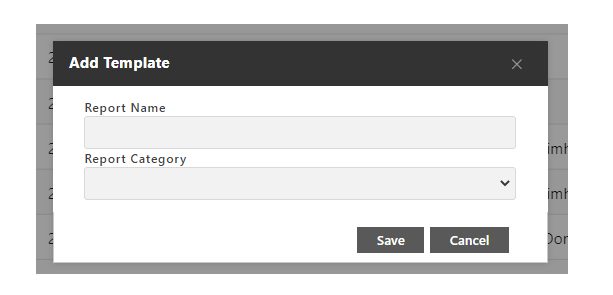
PIVOT MODE
Pivot mode is a powerful tool to calculate, summarize, and analyze data quickly. You are then able to identify patterns, and trends in your data.
Toggle Pivot Mode on at the top right of the screen.
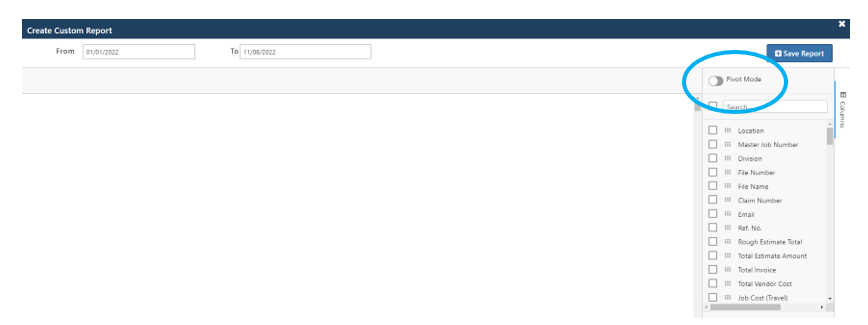
Remove all checkboxes and add only the data you would like to see.
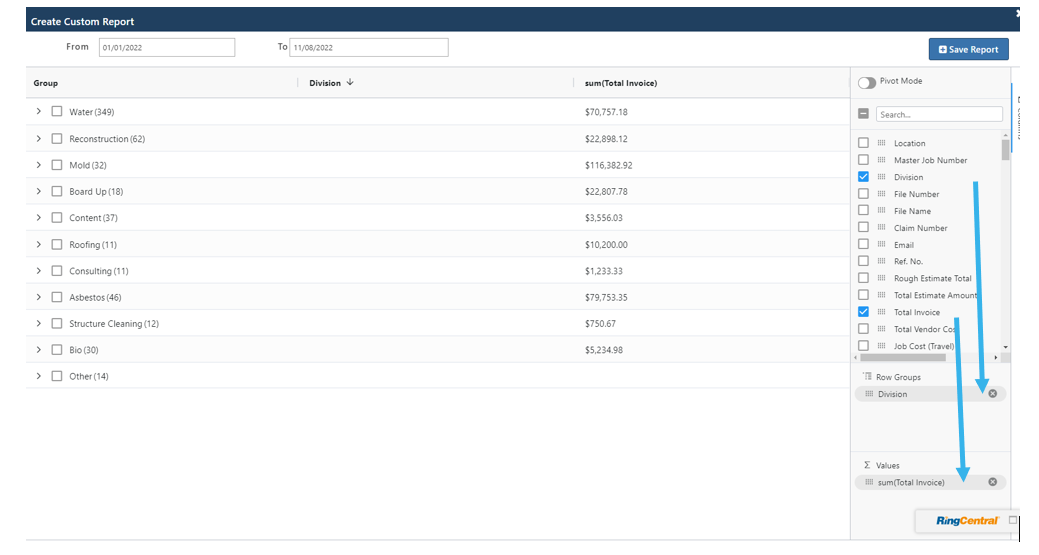
For example, for a departmental summary add division & total invoiced 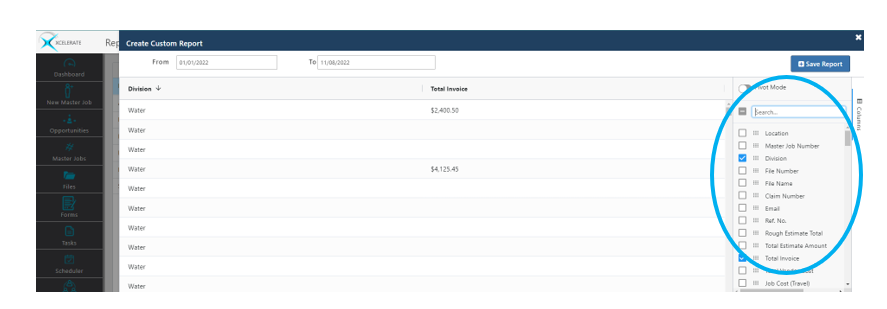
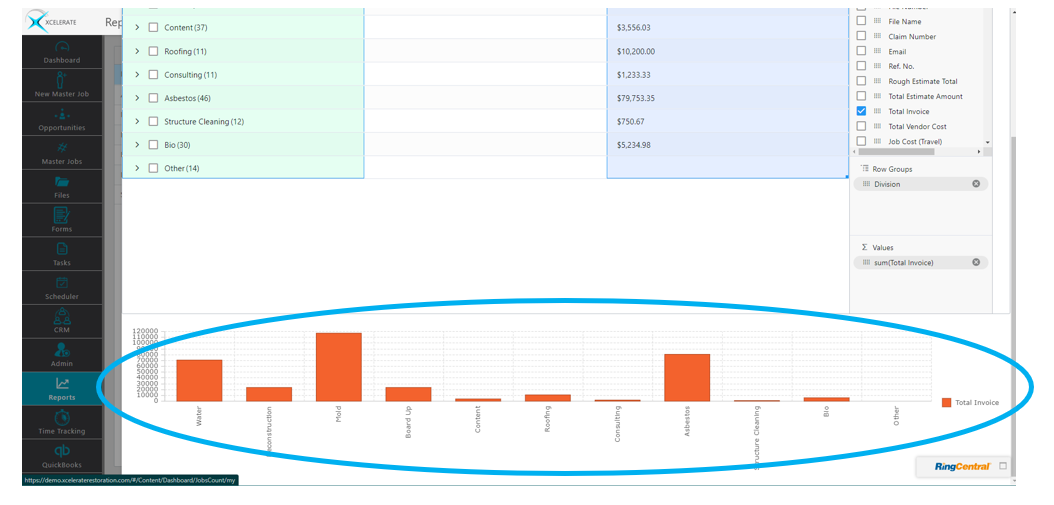
Click and drag Division to Row Group & Total Invoiced to Value to summarize the data accordingly.
CHARTS & GRAPHS
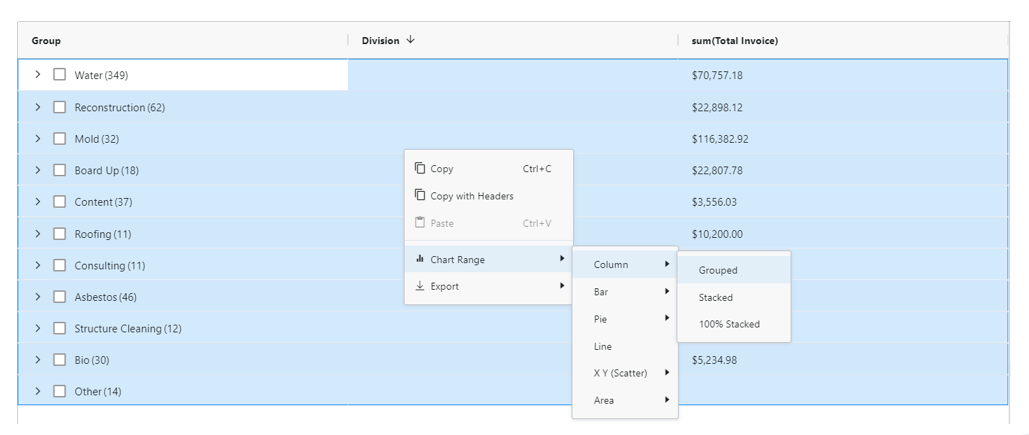
Select any section of data & right-click. Select Chart Range and the desired chart type.
The chart will appear below the data set
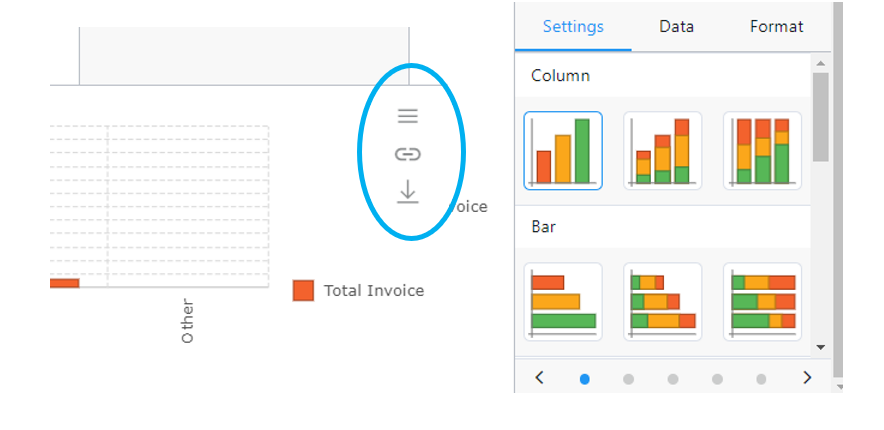
Hovering over the chart will give you setting options to adjust the appearance of the chart, unlink & download as an image.
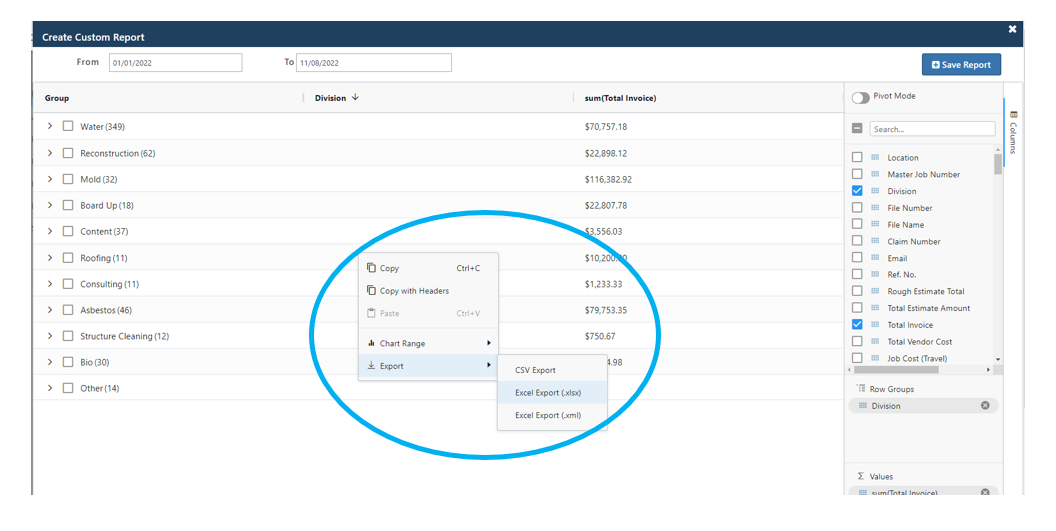
EXPORTING
Right-click on any report and select your method of export.